


FXOpen

EUR/USD is declining heavily and it is currently consolidating above the 1.0880 support area. USD/JPY climbed higher nicely, but it is facing hurdles near the 110.00 resistance area.
Important Takeaways for EUR/USD and USD/JPY
- The Euro declined heavily below the 1.1000 and 1.0940 support levels.
- There is a major bearish trend line forming with resistance near 1.0925 on the hourly chart of EUR/USD.
- USD/JPY climbed higher nicely above the 109.25 and 109.50 resistance levels.
- There is a major contracting triangle forming with resistance near 109.95 on the hourly chart.
EUR/USD Technical Analysis
In the past few days, the Euro declined steadily below the 1.1100 and 1.0980 support levels against the US Dollar. The EUR/USD pair even broke the 1.0950 support level to enter a bearish zone.
Moreover, there was a close below the 1.0940 level and the 50 hourly simple moving average. A new 2020 low is formed at 1.0891 on FXOpen and the pair is currently correcting higher.
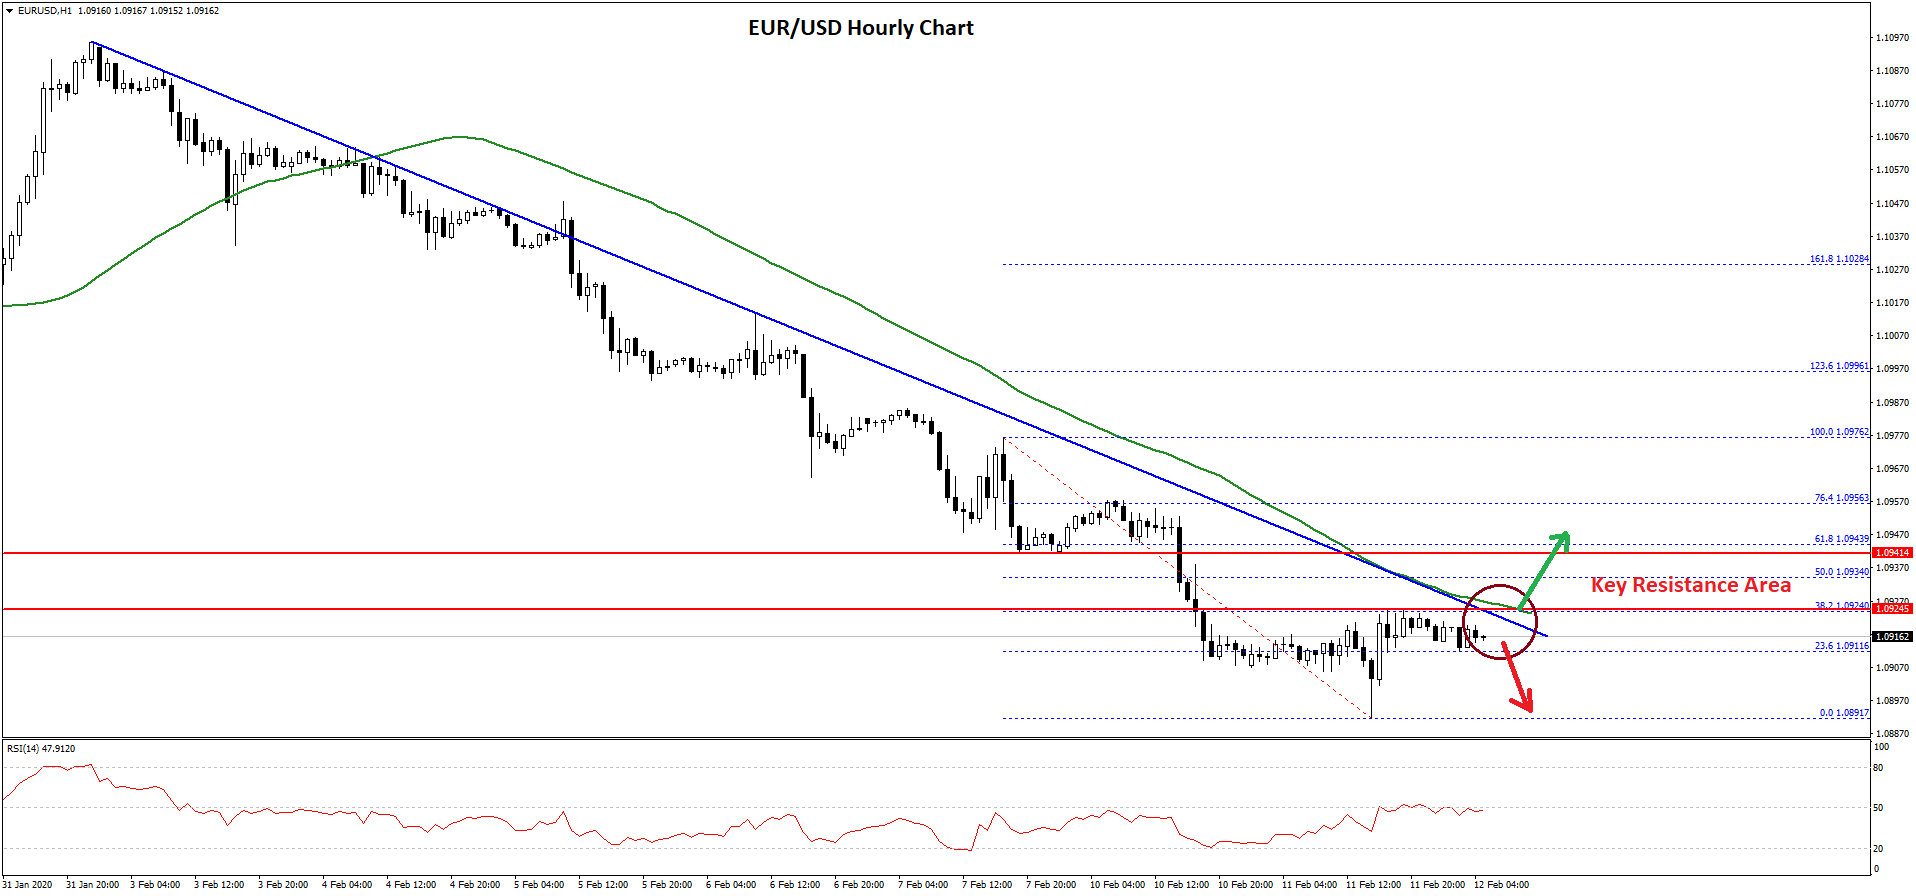
It traded above the 1.0900 level and climbed above the 23.6% Fib retracement level of the recent slide from the 1.0976 high to 1.0891 low. However, the pair is facing a strong resistance near the 1.0925 level.
Moreover, there is a major bearish trend line forming with resistance near 1.0925 on the hourly chart of EUR/USD. Above the trend line, the 50% Fib retracement level of the recent slide from the 1.0976 high to 1.0891 low is at 1.0935.
Finally, the EUR/USD pair must move above the 1.0940 resistance area and the 50 hourly simple moving average to start a decent recovery in the coming sessions. The next hurdle is seen near the 1.0980 level.
Conversely, if the pair fails to continue higher above 1.0940, there is a risk of more losses. On the downside, an initial support is near the 1.0880 level. If the pair fails to stay above the 1.0880 level, there is a risk of more losses towards the 1.0840 level.
USD/JPY Technical Analysis
The US Dollar rallied sharply above 109.00 this past week against the Japanese Yen. The USD/JPY pair broke many resistances near 109.25 and 109.40 to move into a positive zone.
Moreover, there was a close above the 109.50 level and the 50 hourly simple moving average. Finally, the pair tested the 110.00 resistance area, where the bears emerged.
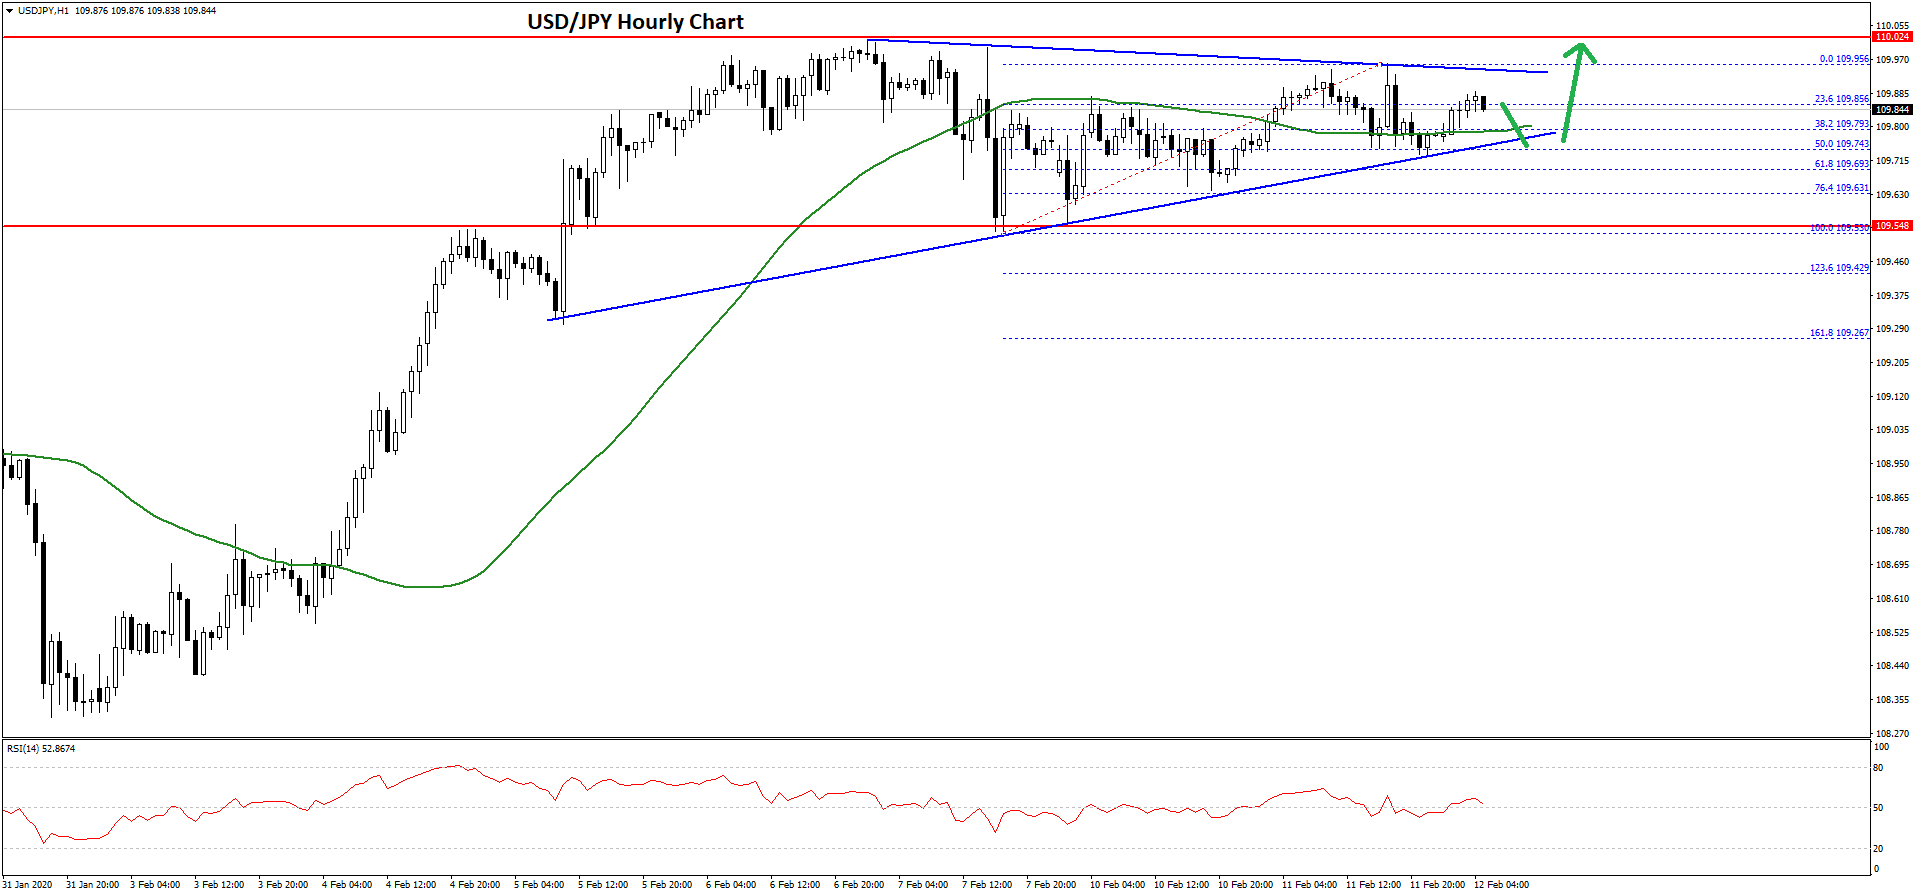
The pair started consolidating gains below 110.00 and remained well bid above 109.50. The last swing low was near 109.53 and the high was at 109.95.
The corrected lower below the 38.2% Fib retracement level of the upward move from the 109.53 low to 109.95 high. However, the pair remained supported near the 109.75 level.
It seems like there is a major contracting triangle forming with resistance near 109.95 on the hourly chart. If there is an upside break above the 109.95 and 110.00 levels, the pair could rise sharply in the near term.
In the mentioned case, the pair might test the 110.50 level. Conversely, the pair could struggle to stay above the triangle support, and the 50% Fib retracement level of the upward move from the 109.53 low to 109.95 high.
If USD/JPY slides below the 109.75 and 109.50 supports, it could start a strong downside correction towards 109.00 or even 108.80.
Trade over 50 forex markets 24 hours a day with FXOpen. Take advantage of low commissions, deep liquidity, and spreads from 0.0 pips. Open your FXOpen account now or learn more about trading forex with FXOpen.
This article represents the opinion of the Companies operating under the FXOpen brand only. It is not to be construed as an offer, solicitation, or recommendation with respect to products and services provided by the Companies operating under the FXOpen brand, nor is it to be considered financial advice.
Stay ahead of the market!
Subscribe now to our mailing list and receive the latest market news and insights delivered directly to your inbox.


Latest articles

Intel (INTC) Shares Surge by Approximately 14%
As shown in the Intel (INTC) stock chart:
→ Trading opened yesterday with a strong bullish gap.
→ By the end of the session, shares had risen by approximately 14% compared to the previous day's closing price.
According to Dow Jones Market

Gold Price Nears $3,000 for the First Time in History
As shown in the XAU/USD chart today, gold is at a record high, just $5 away from the key psychological level of $3,000. Moreover, on the futures market, COMEX data indicates that gold futures have already surpassed this

What Is Dollar-Cost Averaging (DCA) in Investing and Trading?
Dollar-cost averaging (DCA) is a popular strategy used by investors and traders to manage market fluctuations and build positions over time. Instead of trying to time the market, DCA focuses on consistent, regular investments regardless of price movements. This article